
Collect the data
Daily candles from four verified exchanges — back to 2011 for Bitcoin — plus a market snapshot every five minutes.
Long-term crypto price predictions for 511 coins, quarter by quarter, from three months to ten years.
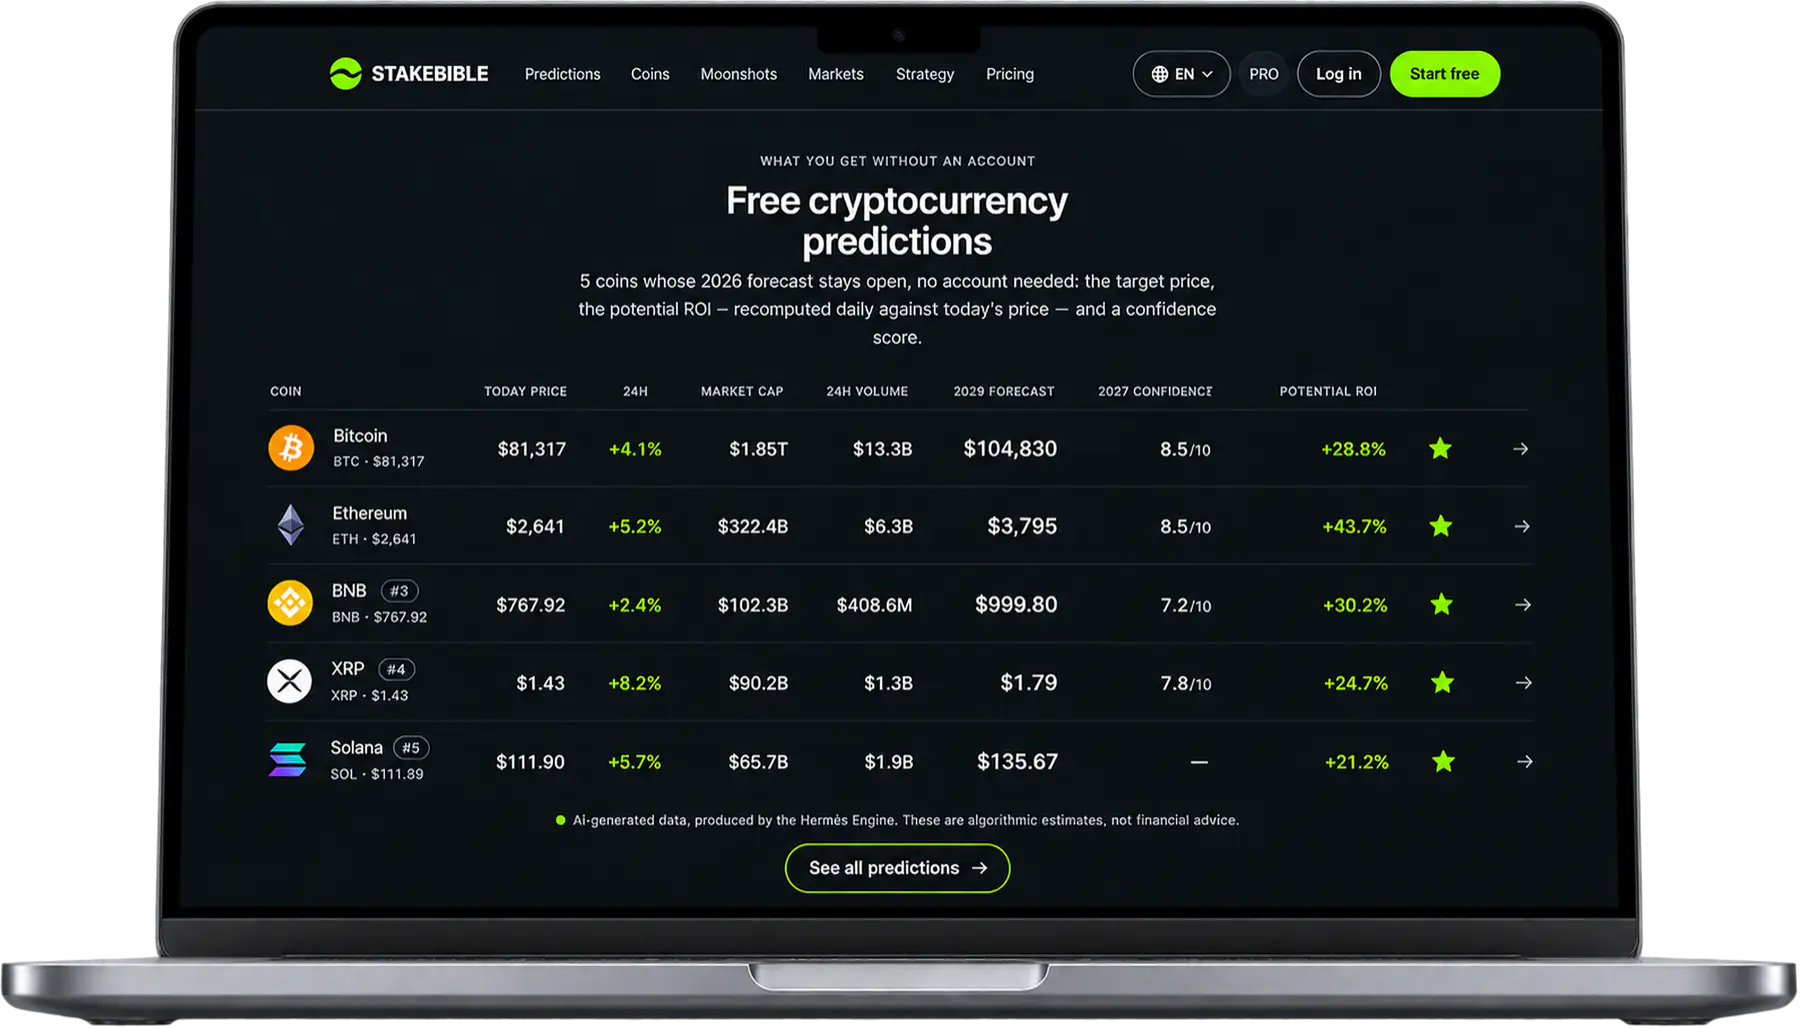
5 coins open to everyone, no account needed: forecast, multiplier and confidence for any year.
Tap the star to follow a coin — alerts for it, and your list in My account.
The full list could not be loaded; the table shows the first rows only.
| Favourite | ||||||||||||
|---|---|---|---|---|---|---|---|---|---|---|---|---|
| 1 |  BTC $77,364 |
$77,364 | -0.7% | $1.55T | $109,143 | ×1.41 | 9.2/10 | $159,445 | ×2.06 | $109,143×1.41 | 9.2/10 | |
| 2 |  ETH $2,287 |
$2,287 | -0.2% | $279.4B | $3,765 | ×1.65 | 9/10 | $5,943 | ×2.60 | $3,765×1.65 | 9/10 | |
| 4 |  BNB×BTC
BNB $699.00 |
$699.00 | -0.9% | $93.1B | $971.73 | ×1.39 | 7.2/10 | $1,417 | ×2.03 | $971.73×1.39 | 7.2/10 | |
| 5 |  XRP×BTC
XRP $1.27 |
$1.27 | +1.6% | $80.4B | $1.72 | ×1.35 | 7.8/10 | $2.51 | ×1.97 | $1.72×1.35 | 7.8/10 | |
| 7 |  Solana×BTC
SOL $93.16 |
$93.16 | -1.3% | $54.9B | $135.25 | ×1.45 | 8/10 | $197.66 | ×2.12 | $135.25×1.45 | 8/10 | |
| 8 |  TRON×BTC
TRX $0.3225 |
$0.3225 | +1.0% | $30.6B | $0.4934 | ×1.53 | 7.1/10 | $0.7195 | ×2.23 | $0.4934×1.53 | 7.1/10 | |
| 10 |  ZEC $1,195 |
$1,195 | -5.6% | $20.3B | $809.94 | ×0.68 | 6.5/10 | $560.10 | ×0.47 | $809.94×0.68 | 6.5/10 | |
| 11 |  HYPE $86.38 |
$86.38 | +0.0% | $19.2B | $58.94 | ×0.68 | 7.2/10 | $40.76 | ×0.47 | $58.94×0.68 | 7.2/10 | |
| 12 |  Dogecoin×BTC
DOGE $0.0751 |
$0.0751 | -0.4% | $11.7B | $0.1048 | ×1.40 | 7.3/10 | $0.1529 | ×2.03 | $0.1048×1.40 | 7.3/10 | |
| 13 |  Chainlink×BTC
LINK $11.10 |
$11.10 | -2.3% | $8.5B | $14.78 | ×1.33 | 8.5/10 | $21.55 | ×1.94 | $14.78×1.33 | 8.5/10 | |
| 17 |  ADA $0.1898 |
$0.1898 | -0.6% | $7.1B | $0.1258 | ×0.66 | 7.9/10 | $0.0870 | ×0.46 | $0.1258×0.66 | 7.9/10 | |
| 19 |  NEAR $3.84 |
$3.84 | -5.6% | $5.0B | $2.68 | ×0.70 | 7.8/10 | $1.85 | ×0.48 | $2.68×0.70 | 7.8/10 | |
| 20 |  XLM $0.1639 |
$0.1639 | -2.6% | $5.7B | $0.1470 | ×0.90 | 8.3/10 | $0.1393 | ×0.85 | $0.1470×0.90 | 8.3/10 | |
| 21 |  BCH $276.80 |
$276.80 | -0.1% | $5.6B | $248.36 | ×0.90 | 7.3/10 | $235.34 | ×0.85 | $248.36×0.90 | 7.3/10 | |
| 22 |  LTC $54.15 |
$54.15 | -1.4% | $4.2B | $49.83 | ×0.92 | 7.1/10 | $47.22 | ×0.87 | $49.83×0.92 | 7.1/10 |
Statistical forecasts from the Horizon Engine; AI research can keep a coin out and caps the confidence, but never sets a price. Algorithmic estimates, not financial advice. AI-powered crypto predictions combine historical market data, backtesting, and research-based confidence assessments.








| Coin | Price if top 100 · × | Risk |
|---|---|---|
SSV $2.29 |
$149.08×65.2 | 2.8 |
RPL $1.50 |
$95.80×64.0 | 2.4 |
CELO $0.0733 |
$3.60×49.1 | 2.5 |
PROVE $0.1908 |
$11.24×58.9 | 3.2 |
BARD $0.1109 |
$6.02×54.3 | 3.2 |
RONIN $0.0496 |
$2.84×57.2 | 4.2 |
ANKR $0.00386 |
$0.2191×56.8 | 3.8 |
RE $0.3056 |
$13.73×44.9 | 2.8 |
Projects outside the top 100, analysed with sourced web research: only those judged able to get in, with a path of at least ×3. Real upside, and an equally real risk of total loss.
See all high-potential coinsFour stages, in this order: the data comes in, the market is read, the model learns, the forecast comes out. Every stage has to hand the next one something checkable.
Daily candles from four verified exchanges — back to 2011 for Bitcoin — plus a market snapshot every five minutes.
Cycle position and halving phase feed the Bitcoin model; volatility, drawdown, market breadth and an altseason score are tracked as well, and RSS headlines are matched to the coins they actually name.
Statistical models refitted from scratch on every run: power-law support and a halving cycle whose swings shrink, for Bitcoin; every other coin as a ratio to it.
A price band with a coverage level, at quarterly resolution, and, for every coin with research, a confidence score — measured at the nearest horizons, declared beyond. Never a single number.
Every forecast is stored with the day it was made. When its horizon arrives, it is graded against the price that actually happened: inside the published band, or outside it. The grades add up to a measured coverage for each horizon, and they can only ever lower the confidence we show — never raise it. Until enough grades exist, we publish no accuracy figure at all.
The first horizons of the current forecasts come due on 1 February 2027.
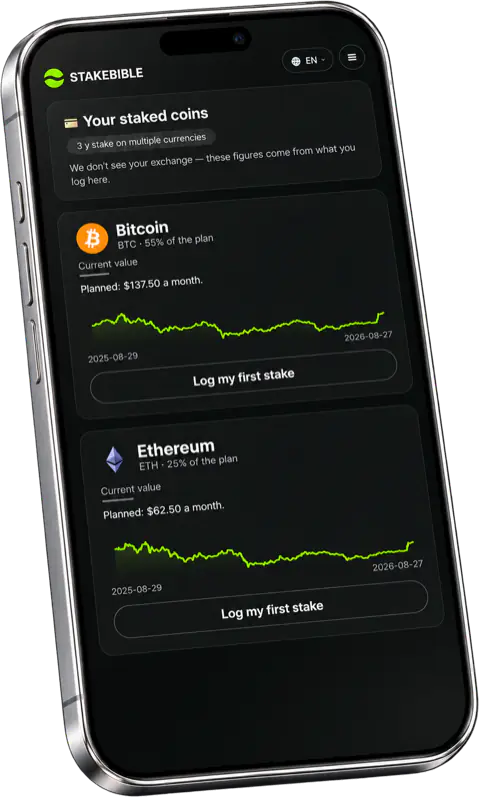
See how StakeBible turns forecasts into a structured plan, with reminders on the days you choose.
Crypto money gets committed on impulse.
The decision is made first.
The amount grows with excitement rather than evidence.
A coin makes the news after the move, not before it.
An entry without a horizon becomes a hold by default.
A forecast does not tell you how much to commit, or when. The engine turns yours into an investment plan.
The same stake every month, whatever the price does.
Your monthly stake, pointed at the coins sitting deepest below the predicted path.
An email when a coin in your plan closes at a new all-time high or low.
DCA: a reminder on your stake day. Ladder: the all-time highs and lows of the coins in your plan.
A chain of checks between the raw data and a published range — never a single number.
History stops being history: the model is refit from scratch on every run, into a price band at quarterly resolution.
Grounded search adds only what has no free API: the macro backdrop, and a per-coin trust rating.
News scanning matches a headline only to the coins it genuinely names, then queues those coins for a targeted re-read.
Every forecast that reaches its horizon is scored against what the price actually did.
Predictions for all 511 coins, unlimited strategies and smart notifications, all in one subscription.
If we don’t exceed your expectations, cancel in a few clicks, anytime.